
You’ve built your store. Products are listed, checkout is ready, and you’re open for business. But now what?
Here’s the thing most store owners don’t realise: the answers to “What should I do next?” are already sitting inside your control panel, quietly waiting for you to take a look.
We’re excited to announce that FreeWebStore’s brand-new Reporting section is now live — and it’s available on every single plan, including the free Community plan. No upgrades, no hidden paywalls, no “contact sales.” Just pure, actionable data about your store, your customers, and your products.
What’s New?
You’ll find the new Reporting section in your control panel sidebar, and inside it are five powerful pages designed to give you a complete picture of your store’s health:
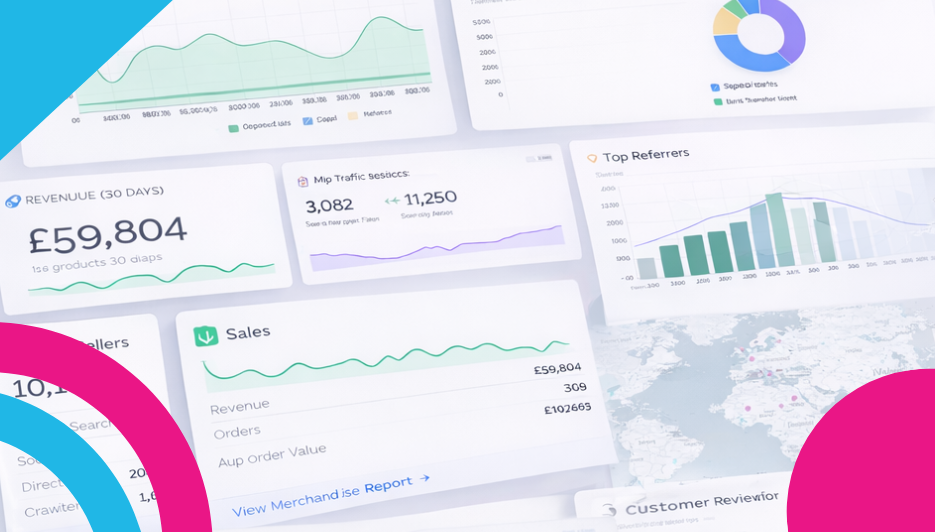
- Overview — Your at-a-glance dashboard with headline stats on revenue, orders, and visitors, plus quick-link panels to every other report.
- Traffic — Everything about who’s visiting your store: which channels are driving traffic, which social platforms and search engines are sending people your way, and even how much traffic you’re getting from AI platforms like ChatGPT and Perplexity.
- Sales — The full financial story: revenue trends, average order values, your busiest days and months, payment method breakdowns, customer locations, top customers, and your revenue milestones over time.
- Merchandise — A deep dive into your product catalogue: top sellers, category performance, stock levels, product quality scores, customer reviews, and — our personal favourite — zero-result searches that show you exactly what customers are looking for that you don’t stock yet.
- Live Map — An interactive map showing your recent orders pinned to real locations, with an order panel and adjustable time slider. It’s genuinely satisfying to watch.
AI-Powered Insights on Every Page
Here’s the part we’re most proud of: at the top of each report, you’ll find an AI-powered summary that reads your data and gives you practical, personalised advice. It doesn’t just tell you the numbers — it tells you what to do about them. You’ll get a performance rating, a written analysis of what’s going on, and specific Quick Wins you can action right away. Things like which products to add based on customer search demand, when to send your marketing emails for maximum impact, or which areas of your catalogue need attention.
Why Does This Matter?
Running an online store can feel like guesswork sometimes. Should you post more on Instagram or focus on Google? Is your average order value healthy? Are customers finding what they’re looking for? Which products should you promote this week?
These reports take the guesswork out of it. Every chart, every table, and every AI recommendation is built from your real store data — so the advice is specific to you, not generic tips you’d find in a blog post.
Available to Everyone
We want to be clear about this: these reports are available on every plan, including the free Community plan. You don’t need expensive analytics tools or a degree in data science. We’ve built these reports to be clear, visual, and actionable so that anyone can use them — whether you’re just starting out or doing thousands of orders a month.
Want to Learn More?
We’ve put together a detailed guide for each report page so you can get the most out of them:
- Understanding Your Reports Overview Dashboard
- Understanding Your Traffic Report
- Understanding Your Sales Report
- Understanding Your Merchandise Report
- Understanding Your Live Map
So here’s your homework: head to Reporting → Overview in your control panel, spend five minutes exploring, and action one Quick Win from the AI summary. That’s it. One small step, informed by real data, can make a bigger difference than you’d think.
Happy selling! 🚀
Leave a Reply