
Where to find it: Reporting → Merchandise
If the Sales report tells you how the business is doing, the Merchandise report tells you which products are making it happen — and which ones need attention. This page zooms in on your catalogue and gives you the intel you need to manage your products like a pro. It’s packed with insights you won’t find anywhere else.

AI Catalogue Analysis
At the top, the AI Catalogue Analysis gives you a performance rating and a summary of your product catalogue’s health. It might flag that a large percentage of your products are out of stock, highlight that many product listings have weak data quality scores, or point out that your bestsellers need restocking urgently. This isn’t generic advice — it’s based on your actual inventory and sales data. Hit “View full analysis” for the full picture.
Time Period Tabs
Tabs at the top let you switch between 7 days, 30 days, 90 days, and 12 months, so you can look at recent product performance or take the longer view.
Headline Stat Cards
Three big cards show the state of your catalogue at a glance:
- Total Products — The total number of products in your store.
- In Stock — How many are currently available to buy.
- Out of Stock — How many have run out. If this number is high, you’re losing sales every single day.
Quick-Glance Metrics
Below the headline cards, a row of additional metrics fills in the detail:
- Avg Product Grade — A letter grade (like A, B, or C) scoring the overall data quality and completeness across your catalogue. It also tells you how many products need attention — these are listings with missing photos, thin descriptions, or incomplete data that could be hurting your conversion rate.
- Avg Review Rating — Your store’s average star rating across all reviewed products, plus the count of products with no reviews yet.
- Products Sold — Total units sold in the selected time period.
- Top Seller — Your current number one product, shown with its image so you can spot it instantly.
- Zero Sales — The number of products that didn’t sell a single unit in the selected period. This is your “sitting on the shelf” count.
- Stock Value — The total estimated value of your current inventory.
Top Sellers
A horizontal bar chart showing your best-performing products by units sold. These are your store’s greatest hits — the items customers keep coming back for. The chart makes it easy to see which products are leading the pack and by how much.
Categories
A pie chart breaking down your product distribution by category. See instantly which sections of your catalogue are the biggest, and whether the balance feels right. If one category dominates your sales but only represents a small slice of your catalogue, that’s a signal to expand it.
Low Stock Alerts
A table listing products that are running low or already out of stock. Each row shows the product name (with a clickable link), current stock level, status (highlighted in red when out of stock), and an “Edit” link so you can take action immediately.
This section is genuinely important. Every product sitting at zero stock is a product that customers can see but can’t buy. If it’s a popular item, you’re not just missing one sale — you’re missing every sale until it’s restocked. Check this section regularly and treat it as your restocking to-do list.
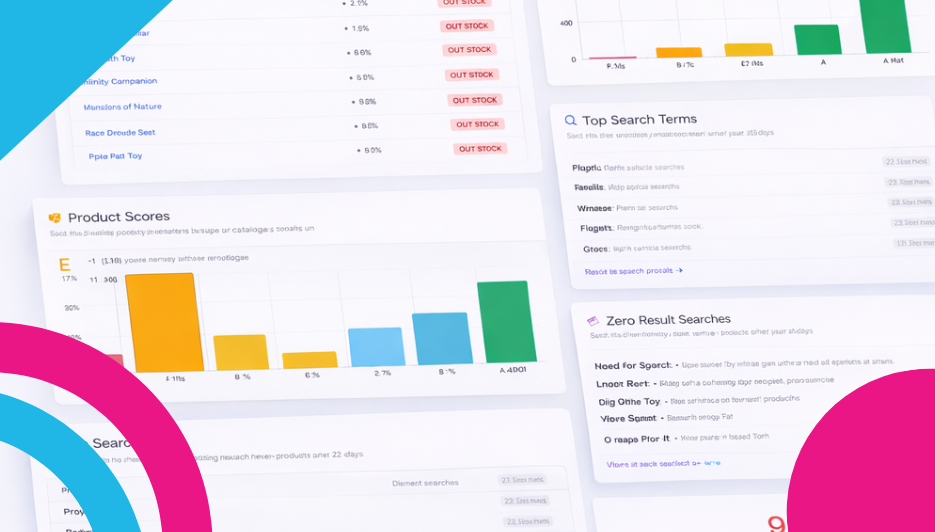
Product Scores
A bar chart grading your products from D through to A/A+, showing how many products fall into each quality tier. This measures how well your product listings are set up — good photos, complete descriptions, accurate pricing, proper categorisation, and so on.
Products with higher scores tend to convert better because they give customers the information and confidence they need to buy. If a large chunk of your catalogue is scoring C or below, spending time improving those listings could directly increase your sales.
Customer Reviews
A bar chart showing the distribution of reviews by star rating — 1 star through 5 stars. See at a glance whether your customers are happy. A healthy store typically has the bulk of reviews at 4 and 5 stars. If you’re seeing a cluster at the lower end, it’s worth investigating what’s going wrong.
It also shows the percentage of products that have reviews and how many have none yet. Products without reviews can feel risky to buyers — encouraging reviews through the built-in review invite system can make a real difference.
Top Search Terms
A list of the most popular search terms customers are typing into your store’s search bar, with the number of searches for each. This is priceless market intelligence — it tells you exactly what people are looking for when they visit your store.
If your top search terms match your top-selling products, everything is aligned. If customers are searching for things that are buried deep in your catalogue, you might need to improve your navigation or feature those products more prominently.
Zero-Result Searches
This might be the most actionable section on the entire page. It shows search terms where customers searched your store and found absolutely nothing. Each term is displayed as a coloured tag with its search count.
Think about what this means: real people came to your store, typed in what they wanted to buy, and got zero results. That’s unmet demand staring you in the face. If you see the same terms appearing repeatedly, those are products you should seriously consider adding to your catalogue. Your customers are literally telling you what they want to buy — all you have to do is listen.
Dead Stock
At the very bottom, the Dead Stock section shows the number of products with zero views in the selected period — products that nobody is even looking at, let alone buying. It includes a link to “Review your product catalogue” so you can take action.
Dead stock ties up your time and clutters your catalogue. Consider whether these products need better visibility (maybe they’re buried in a forgotten category), a refresh (new photos, updated description), a clearance promotion, or simply retiring them to keep your catalogue focused and fresh.
Why It Matters
Not all products are created equal. Some are your star performers, some are steady earners, and some are just sitting there. The Merchandise report helps you identify which is which, so you can make smarter decisions about what to promote, what to restock, what to improve, and what to retire. The Product Scores and Review charts also help you improve the quality of your listings — because a great product with a terrible listing is a missed opportunity.
What to Do With It
Review your Dead Stock. If products haven’t been viewed or sold in months, they’re dead weight. Run a clearance sale, bundle them with popular items, or retire them to keep your catalogue sharp.
Act on Zero-Result Searches immediately. This is your customers handing you a shopping list of products to add. Don’t ignore it.
Tackle Low Stock Alerts before they become Out of Stock. Prevention is always better than cure. Set a regular rhythm for checking this section and restocking before you hit zero.
Improve your Product Scores. If a lot of products are graded C or below, dedicate some time to improving those listings. Better photos, fuller descriptions, accurate pricing. Higher scores usually mean better conversions.
Promote your Top Sellers. Your best performers deserve prime real estate on your homepage and social channels. Make them easy to find.
Encourage reviews. Products with reviews sell better than products without them. Use the built-in review invite feature to ask customers for feedback after they’ve received their order.
Leave a Reply