
Where to find it: Reporting → Traffic
If the Overview page is your morning coffee, the Traffic report is your full breakfast. This is where you find out who’s visiting your store, how they found you, and which channels are actually pulling their weight. It’s one of the most information-rich pages in your control panel — and every section of it is designed to help you make smarter decisions about where to spend your time and energy.

AI Traffic Analysis
At the very top, the AI Traffic Analysis gives you a performance rating — something like “FAIR,” “GOOD,” or “GREAT” — along with a written summary of your traffic health. It might tell you that your organic search growth is strong but your social media traffic is practically non-existent, or that your biggest opportunity is to start using social media consistently to reach new customers. Hit “View full analysis” for the full deep dive.
Time Period Tabs
Just below the AI summary, you can switch between different time windows — 14 days, 7 days, 30 days, and more. This lets you zoom in on a recent week or step back to see the broader trend. Everything on the page updates to reflect the period you’ve selected.
Headline Stat Cards
Four big cards give you the instant snapshot:
- Visitors — Your total visitor count for the selected period, with a sparkline trend and percentage change versus the previous period.
- Organic Search — How many visitors found you through search engines like Google, with its own trend and comparison.
- Social Traffic — Visitors from social media platforms, so you can see whether your social efforts are paying off.
- Crawlers — The number of bot and crawler visits. This isn’t “bad” traffic — crawlers from Google and other search engines are indexing your site so your products can appear in search results.
Traffic by Channel
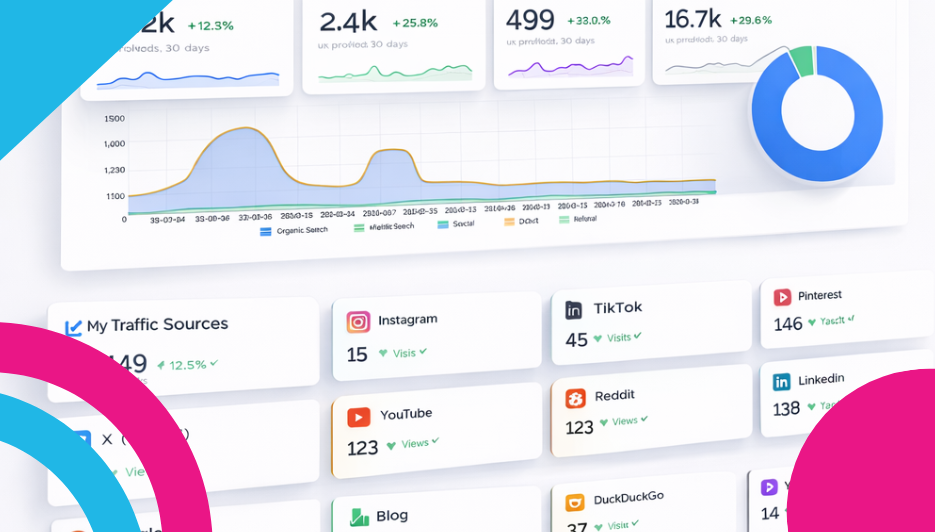
This is the centrepiece of the page — a time-series area chart that breaks down your human traffic by source over time: Organic Search, Direct, Social, AI, and Referral. Next to it, a pie chart shows the overall split across channels.
This chart answers one of the most important questions in ecommerce: where are your visitors actually coming from? If the Organic Search area dominates the chart, your SEO is doing the heavy lifting. If Direct is huge, people are typing your URL or using bookmarks. If Social is a thin sliver, you know that’s an area with room to grow.
Your Traffic Sources
This section gets really granular, breaking your traffic down into three categories with individual cards for each source:
Social Platforms
Individual cards for Facebook, Instagram, TikTok, Pinterest, X (Twitter), YouTube, Reddit, LinkedIn, and Threads. Each card shows its visitor count and percentage change. If a platform shows “No traffic detected”, you’ll see a helpful link to set it up or learn more — so it doubles as a setup checklist for your social presence.
AI Platforms
This is a newer and genuinely exciting section. FreeWebStore tracks traffic from ChatGPT, Gemini, Perplexity, and Copilot — the AI tools that people are increasingly using to discover products. If you see numbers here, it means AI assistants are recommending your store or products to real people. This is the future of product discovery, and you’re watching it happen in real time.
Search Engines
Cards for Google, Bing, DuckDuckGo, Yahoo, Yandex, and Baidu, each with their visitor count and trend. Google will likely dominate, but don’t ignore the others — Bing traffic is often underestimated, and DuckDuckGo users tend to be privacy-conscious and intentional buyers.
Top Referrers
A ranked table listing the external websites sending you the most traffic, with a visual bar showing relative volume and a visit count. These are sites that link to your store — it could be a blog that reviewed your products, a directory listing, a forum mention, or another business linking to you.
This is one of the most underrated sections on the page. If a website you’ve never heard of is sending you dozens of visitors, go check it out. Someone might have featured your products, and that’s a relationship worth nurturing with a thank-you or a collaboration.
Marketing Campaigns
If you’re using UTM-tagged links in your email campaigns, social ads, or other marketing, this section tracks them. It shows the source, campaign name, channel, and visit count for each tracked campaign. This is how you measure whether your marketing efforts are actually driving traffic — not just getting likes, but getting clicks.
Crawler Activity
At the bottom of the page, a breakdown of your bot traffic by type: Search Engines, AI Services, Social Platforms, SEO Tools, and Other. Each category gets a coloured bar showing its share of total crawler traffic, along with a percentage.
Don’t worry about crawlers — healthy crawler activity is a good thing. It means search engines are indexing your pages, social platforms are generating previews when people share your links, and AI services are learning about your products. More crawler activity typically means better visibility.
Why It Matters
Traffic is the lifeblood of any online store. You can have the most beautiful products at the best prices, but if nobody’s visiting, nobody’s buying. The Traffic report helps you understand not just how many visitors you’re getting, but where they’re coming from, which channels are working, and where the opportunities are.
What to Do With It
Check platforms showing “No traffic detected.” Those aren’t just blanks — they’re opportunities. Each one links to a setup guide, so you can start building your presence on platforms you haven’t tapped into yet.
Double down on what works. If one social platform is driving real visits while others show zero, focus your energy there. Don’t spread yourself thin across every platform — go where your audience already is.
Pay attention to AI traffic. If ChatGPT or Perplexity are sending visitors your way, your products are being recommended by AI tools. Make sure your product descriptions and metadata are clear and well-structured to keep that momentum going.
Watch the Top Referrers. If a website you’ve never heard of is sending traffic, investigate. It could be a blog feature, a forum recommendation, or a directory listing you didn’t know about.
Use Marketing Campaigns to measure your efforts. Running email campaigns or social ads? This is where you see whether they’re actually driving traffic. No results showing up? Time to check your UTM tags or rethink your approach.
Don’t panic about crawlers. Healthy crawler activity from search engines and social platforms is a sign that your site is being indexed properly and your products can appear in search results and feeds.
Leave a Reply