
Where to find it: Reporting → Overview
Think of the Overview page as your store’s morning coffee — a quick snapshot that tells you how things are going before you dive into the details. It’s the first thing you see when you open Reporting, and it’s designed to give you everything you need in a single glance.

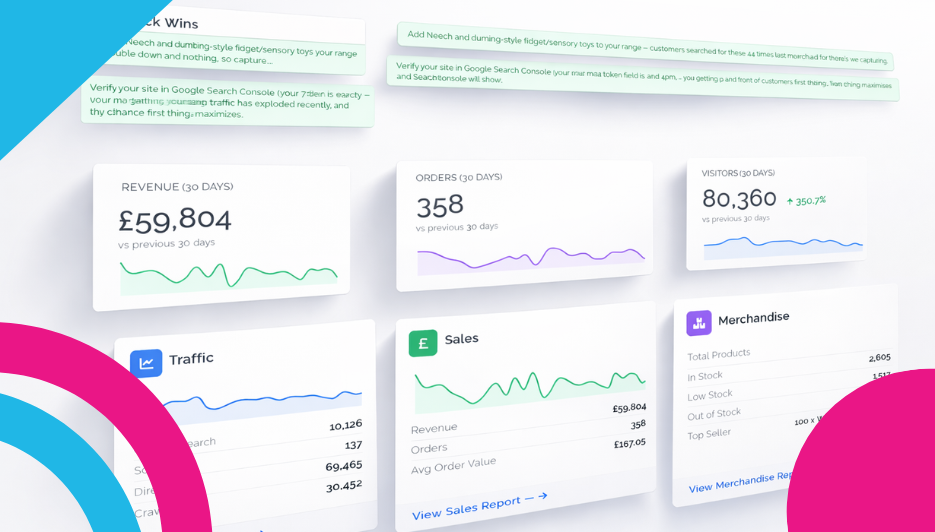
The AI Summary & Quick Wins
Right at the top of the page, you’ll find an AI-powered summary — a plain-English analysis of your store’s performance. This isn’t a generic paragraph of advice; it’s built from your actual data. It might tell you that your store is performing well with strong organic search growth, or flag that a large percentage of your products are out of stock and you’re leaving money on the table.
Below the summary, you’ll see colour-coded Quick Wins — specific, actionable suggestions you can tackle right away. These are the kind of insights that would normally take hours of spreadsheet analysis to uncover, served up in a sentence. For example:
- A suggestion to add specific products that customers have been searching for in your store but couldn’t find.
- A reminder to verify your site in Google Search Console so you can see which keywords are driving your organic traffic growth.
- Advice on the best time to send your marketing emails, based on when your orders actually peak during the day.
You can expand the section with “View full analysis” to get the complete AI breakdown.
Your Headline Stats
Below the AI summary sit three big headline stat cards covering the last 30 days:
- Revenue (30 Days) — Your total sales value, with a sparkline trend graph showing the daily pattern and a comparison to the previous 30 days.
- Orders (30 Days) — Your total order count for the period, again with a sparkline and comparison.
- Visitors (30 Days) — How many people visited your store, with a percentage change indicator. A big green arrow and percentage here means your traffic is growing — always a good sign.
Each card gives you an instant feel for whether things are heading up, down, or holding steady. You don’t need to click into anything else — just glance at the three numbers and the three trend lines.
The Summary Panels
Further down the page, three summary panels give you a quick preview of the deeper reports:
Traffic Panel
A mini chart showing your visitor trend over the period, with a breakdown of your traffic sources: Organic Search, Social, Direct, and Crawlers. This tells you at a glance where your visitors are coming from. Each source shows its visitor count so you can see the split instantly. At the bottom, “View Traffic Report →” takes you to the full Traffic report.
Sales Panel
A mini revenue chart alongside three key numbers: your total Revenue, your Order count, and your Average Order Value. The AOV is a particularly useful metric — it tells you how much each customer spends per order on average, and tracking it over time helps you understand whether your pricing, upselling, and promotions are working. “View Sales Report →” takes you deeper.
Merchandise Panel
A product inventory summary showing Total Products, In Stock, Low Stock, Out of Stock, and your current Top Seller. If the Low Stock or Out of Stock numbers are highlighted in red, that’s your cue to take action — every out-of-stock product is a potential lost sale. “View Merchandise Report →” takes you to the full product breakdown.
Why It Matters
The Overview page is your “pulse check.” You don’t need to be a data analyst to glance at this page and know whether last week was better than the week before. If you see a sudden spike in visitors, think about what you did differently — did you post on social media? Run a promotion? Share a link somewhere new? Conversely, a dip might tell you it’s time to give your store a little love and attention.
And the Quick Wins at the top take the guesswork out entirely — they tell you exactly what to focus on right now, based on what’s actually happening in your store.
What to Do With It
Get into the habit of checking this page regularly — even just once a week. Here’s a simple routine:
- Start with the AI summary and Quick Wins. Is there anything easy you can action today? A product to add, a setting to change, an email to schedule?
- Scan the three headline cards. Are revenue, orders, and visitors trending in the right direction? Any big swings compared to last month?
- Glance at the summary panels. Is traffic coming from the channels you expect? Is your average order value holding up? Are any products running low on stock?
- Click through to whichever detailed report needs your attention most.
This page is your starting point. It doesn’t try to show you everything — it shows you just enough to know where to look next. And that’s exactly what makes it so useful.
Leave a Reply to Unlock Your Store's Potential with FreeWebStore Reporting ToolsCancel reply